

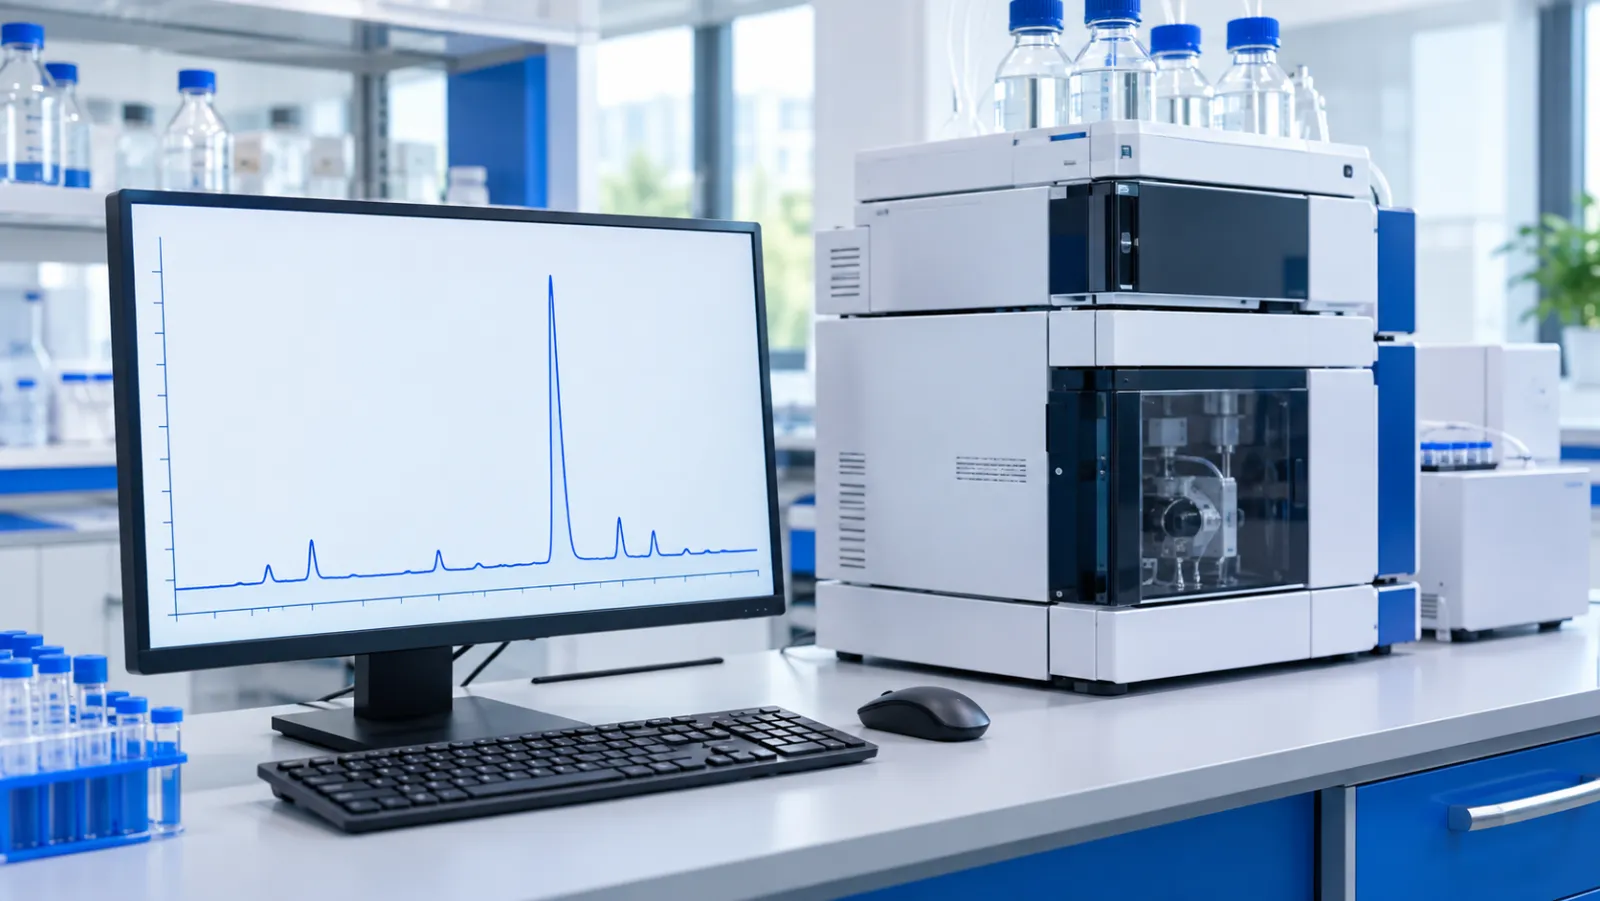
In short: HPLC purity is the share of the UV-detected signal in a chromatogram that falls in the main peak, under one specific method. It measures peptide-related impurities that the method separates and detects. It does not measure water, counter-ions or substances invisible to UV light, and on its own it does not confirm a peptide’s identity.
Purity is usually the most prominent number on a peptide certificate of analysis. This explainer covers how high-performance liquid chromatography (HPLC) produces that number, which impurities it can reveal and where its view ends. Technical terms are defined in the peptide glossary.
What does an HPLC purity percentage measure?
An HPLC purity percentage measures how much of the total integrated peak area in a chromatogram belongs to the main peak. A chromatogram is a plot of detector signal against time: each component the column separates appears as a peak, and software integrates the area under each one. McCarthy et al., in a 2023 paper on peptide reference standards, report HPLC impurities as a percentage of the total detected area 1.
Purity in this sense is relative. It compares the main peak with the other peaks the method detected, not with the total weight of the sample. The European Medicines Agency (EMA) guideline on synthetic peptides treats purity (total and individual impurities) and assay (content) as separate specification tests, and describes a chromatographic assay as one run against a reference standard 2. An area-percent purity figure needs no reference standard, which is also why it cannot tell you how much peptide is present.
How does reversed-phase HPLC separate peptides?
Reversed-phase HPLC separates peptides by hydrophobicity as they travel through a column packed with a water-repelling stationary phase. In a 2007 methods chapter, Mant et al. describe reversed-phase HPLC (RP-HPLC) as the most widely used HPLC mode for peptides, usually run on silica-based packings carrying octyl (C8) or octadecyl (C18) chains. Peptides leave these columns in order of increasing overall hydrophobicity 3.
Most separations use acidic mobile phases of water and acetonitrile containing trifluoroacetic acid (TFA), with the acetonitrile share rising over the run 3. TFA acts as an ion-pairing reagent: its negatively charged anion interacts with positively charged residues on the peptide and changes how they are retained 3.
Detection is usually by ultraviolet (UV) absorbance. Peptide bonds absorb strongly in the far UV, so peptides are generally detected at 210 to 220 nm. The aromatic side chains of tyrosine, phenylalanine and tryptophan also absorb at 250 to 290 nm, but not every peptide contains them 3.
Method choices change what the chromatogram shows. In a 2004 analytical study of synthetic 10-residue peptides carrying one, three or five positive charges, Chen et al. reported that 0.2 to 0.25% TFA in the mobile phase gave optimum resolution for mixtures of multiply charged peptides, higher than the traditional 0.05 to 0.1% range 4.
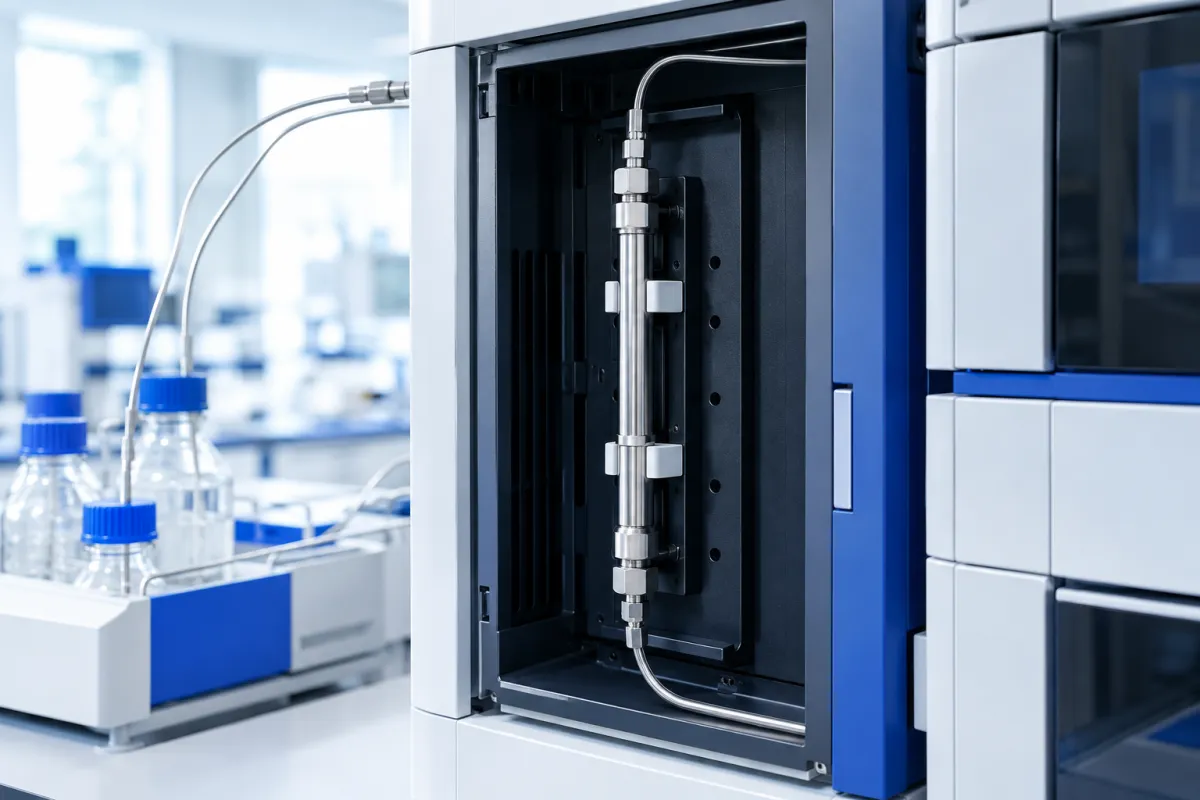 Illustration: a reversed-phase column, where peptides are separated before detection.
How is the purity percentage calculated?
The usual calculation divides the main peak’s area by the sum of all integrated peak areas and multiplies by 100. That simple ratio rests on four assumptions:
- Every impurity is separated from the main peak rather than hidden inside it.
- Every impurity is detected at the chosen wavelength.
- Each component gives a similar detector response for the same mass. The International Council for Harmonisation (ICH) Q3A(R2) guideline on impurities in small-molecule drug substances, which excludes peptides from its scope, notes that impurity estimates can rest on assumptions such as equivalent detector response, and expects a correction factor where response factors are not close 5.
- Only peaks above a threshold are counted. Under ICH Q3A(R2), impurities above the reporting threshold are summed and reported as total impurities 5. For peptide medicines, the EMA expects impurity methods to meet the European Pharmacopoeia reporting threshold of 0.1% 2.
When any of these assumptions fails, the percentage moves away from the true composition of the peptide material.
Which impurities can HPLC reveal?
HPLC reveals impurities that differ enough from the target peptide to form separate peaks, which in synthetic peptides are mostly by-products of synthesis and degradation. A 2014 review by D’Hondt et al. grouped them into impurities from solid-phase peptide synthesis, such as deletion and insertion sequences, diastereomers (versions in which one amino acid has switched to its mirror-image form) formed by racemisation, and protecting-group adducts, as well as oxidation products, dimers and degradation products formed by reactions such as pyroglutamate and succinimide formation 6.
The EMA guideline defines two of these terms. Deletion sequences are peptides missing one or more amino acids through incomplete coupling or deprotection, and truncated sequences are acetylated fragments produced when unreacted chains are capped during synthesis 2.
What does an HPLC purity figure not tell you?
An HPLC purity figure does not tell you how much of the powder is peptide, whether UV-invisible substances are present, whether an impurity sits under the main peak, or whether the main peak is the right peptide.
How much of the powder is peptide. In a 2020 analytical study of synthetic glucagon, Wang et al. measured a purity above 970 mg/g by liquid chromatography with UV detection (LC-UV), close to the manufacturer’s reported 983.72 mg/g. A mass-balance approach, which measured water, TFA, inorganic ions and peptide impurities and subtracted them, gave a glucagon content of 896.36 mg/g, with TFA alone at 103.03 mg/g. The authors attributed the gap to LC-UV measuring only the main constituent, since some impurities do not absorb UV and others overlap with it 7. Net peptide content explained covers this difference.
Substances invisible to UV. In a 2020 case study, Choules et al. found undeclared mannitol at 20% and 43% by weight in two commercially sourced custom peptides, using quantitative proton nuclear magnetic resonance (NMR) spectroscopy. Mannitol does not absorb UV, so a UV chromatogram would not show it 8.
Impurities hidden under the main peak. The EMA guideline warns about the risk of co-eluting impurities in peptide analysis, meaning impurities that leave the column together with the main peptide, states that co-eluting impurities seen as one peak are held to the 1.0% qualification threshold unless otherwise justified, and notes that diastereomers may need specific methods 2. ICH Q2(R2) says that for critical separations, specificity can be shown by the resolution of the two components that elute closest together 9. McCarthy et al. noted that chiral or isobaric (same-mass) amino acids may require additional techniques 1.
Identity. A retention time means little without a reference standard. McCarthy et al. describe HPLC identity testing as comparing the main peak’s retention time with an established reference standard, and running a mixture of sample and standard to check that they elute as a single peak 1. For peptide medicines, the EMA recommends at least two orthogonal identification methods 2, meaning methods that ideally rest on different measurement principles 9. Mass spectrometry for peptides explains how molecular mass is confirmed.
Comparability. A 2009 review by Vergote et al. found pharmacopoeial peptide specifications barely harmonised, with large differences between the European Pharmacopoeia and the United States Pharmacopeia, and inconsistencies within a single pharmacopoeia 10. Combined with the method effects shown by Chen et al. 4, this means two purity figures are only comparable when their methods are stated.
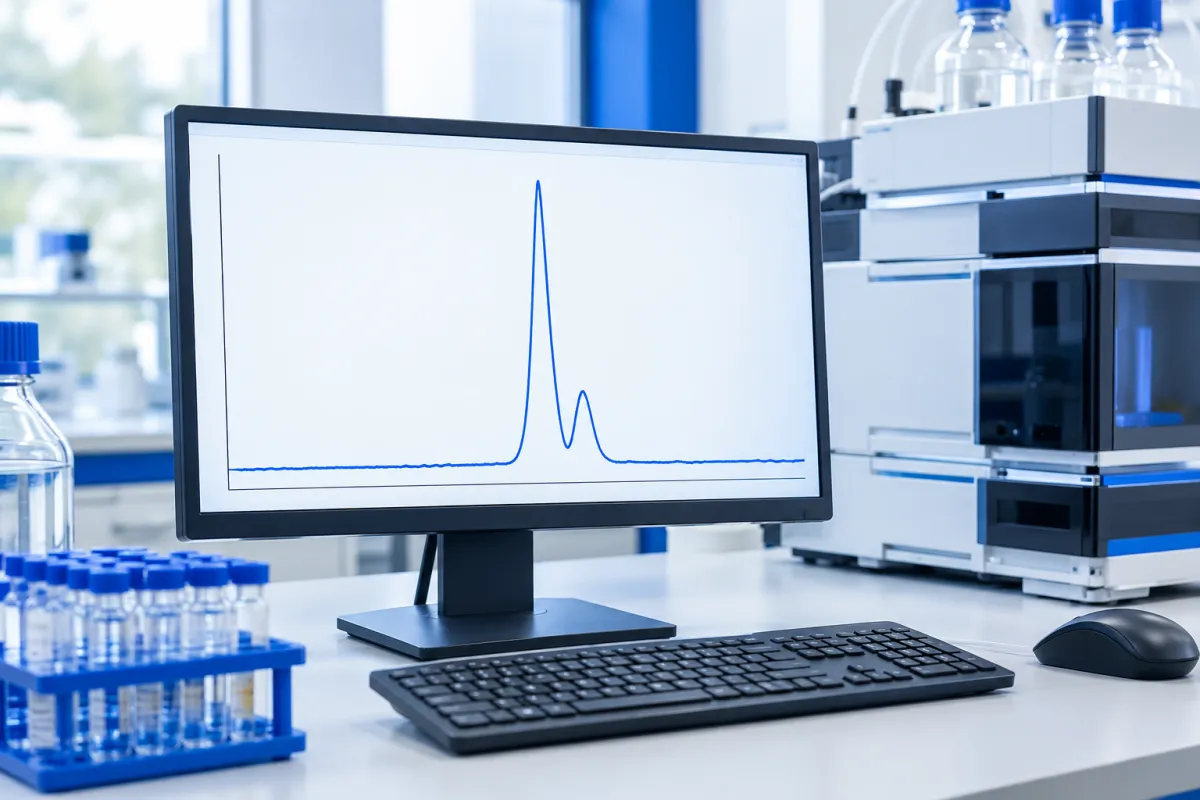 Illustration: a partly overlapping peak, the kind of separation problem an area percentage can hide.
The studies below checked purity or composition with a second, independent method.
| Study | Study type | Material | What was measured | Reported finding |
|---|---|---|---|---|
| Wang, 2020 | Analytical chemistry study | Synthetic glucagon | LC-UV purity compared with mass-balance content | LC-UV purity above 970 mg/g; mass-balance glucagon content 896.36 mg/g; TFA 103.03 mg/g |
| Choules, 2020 | Analytical case study | Two commercially sourced custom peptides | Composition by quantitative proton NMR | Undeclared mannitol at 20% and 43% by weight, not detectable by UV |
| Melanson, 2018 | Analytical chemistry study | Candidate angiotensin II reference material | Purity by mass balance, quantitative NMR and amino acid analysis | TFA counter-ion nearly 25% by mass; final purity 691 ± 9 mg/g |
| Chen, 2004 | Analytical chemistry study | Synthetic 10-residue model peptides | Effect of TFA concentration on RP-HPLC resolution | 0.2 to 0.25% TFA gave optimum resolution for multiply charged peptides |
How do regulators set purity expectations for peptide medicines?
For authorised peptide medicines, impurity limits come from pharmacopoeial thresholds written for peptides rather than from the general small-molecule guideline. ICH Q3A(R2) lists peptides among the substances it does not cover 5. The EMA guideline therefore applies the European Pharmacopoeia thresholds: peptide-related impurities are reported above 0.1%, identified above 0.5% and qualified above 1.0% 2. Qualification means gathering data that justify an impurity at the level specified 5. Where two impurities cannot be separated, a limit may be set for the combined peak 2. These rules apply to medicines and are cited here to show how regulators treat peptide impurities, not as a standard for research materials.
What should you read alongside the purity number?
Read the purity number together with the method and the other entries on the certificate. A useful check covers:
- The method: column type, mobile phase, gradient and detection wavelength.
- The chromatogram: whether it is attached, and whether the main peak and impurity peaks are labelled. ICH Q2(R2) expects representative chromatograms, with relevant components labelled, to be used when showing that a method is specific 9.
- Identity: a separate mass spectrometry result.
- Content, counter-ion and water: separate results that describe the rest of the powder.
Frequently asked questions
What does an HPLC purity percentage mean for a peptide?
It is the main peak’s share of the total integrated peak area in a UV chromatogram, under one stated method. It describes peptide-related impurities that the method separates and detects. It does not describe water, counter-ions or UV-invisible substances, and it is not a measure of how much peptide a sample contains. The EMA treats purity and assay as separate tests for synthetic peptides 2.
Why is peptide HPLC detection done at 210 to 220 nm?
Peptide bonds absorb ultraviolet light strongly in the far UV, so detection at 210 to 220 nm registers peptides whatever their sequence. The aromatic residues tyrosine, phenylalanine and tryptophan also absorb at 250 to 290 nm, but not every peptide contains them, which makes the far-UV range the general choice 3.
Can two laboratories report different purity for the same batch?
Yes. Purity depends on the column, mobile phase, gradient, wavelength and integration settings. Chen et al. showed that changing TFA concentration alone changed how well peptide mixtures were resolved 4, and Vergote et al. found large differences between pharmacopoeial peptide specifications 10. Compare purity figures only when the methods are stated.
Does HPLC purity confirm a peptide’s identity?
Not on its own. An HPLC identity test compares the main peak’s retention time with a reference standard, and McCarthy et al. describe running sample and standard together to check they elute as one peak 1. The EMA recommends at least two orthogonal identification methods for peptide medicines 2. See mass spectrometry for peptides.
Why can HPLC purity be higher than the peptide content of a powder?
Because HPLC purity ignores water, counter-ions and UV-invisible material, while content counts the whole powder. In a 2020 study of synthetic glucagon, Wang et al. measured LC-UV purity above 970 mg/g but a mass-balance glucagon content of 896.36 mg/g, with TFA at 103.03 mg/g 7. Net peptide content explained covers the calculation.
References
- McCarthy D, Han Y, Carrick K, et al. Reference Standards to Support Quality of Synthetic Peptide Therapeutics. Pharm Res. 2023;40(6):1317-1328. doi:10.1007/s11095-023-03493-1. PMID: 36949371. PMCID: PMC10338602. [analytical methods paper with case studies]
- European Medicines Agency. Guideline on the development and manufacture of synthetic peptides (EMA/CHMP/CVMP/QWP/367182/2025; adopted December 2025, in effect from 1 June 2026). https://www.ema.europa.eu/en/development-manufacture-synthetic-peptides-scientific-guideline. Accessed 28 September 2026. [regulatory guideline]
- Mant CT, Chen Y, Yan Z, et al. HPLC analysis and purification of peptides. Methods Mol Biol. 2007;386:3-55. doi:10.1007/978-1-59745-430-8_1. PMID: 18604941. PMCID: PMC7119934. [methods chapter]
- Chen Y, Mehok AR, Mant CT, et al. Optimum concentration of trifluoroacetic acid for reversed-phase liquid chromatography of peptides revisited. J Chromatogr A. 2004;1043(1):9-18. doi:10.1016/j.chroma.2004.03.070. PMID: 15317407. [analytical chemistry study]
- International Council for Harmonisation (ICH). Q3A(R2): Impurities in new drug substances (Step 4 version, 25 October 2006). https://database.ich.org/sites/default/files/Q3A%28R2%29%20Guideline.pdf. Accessed 28 September 2026. [international guideline]
- D’Hondt M, Bracke N, Taevernier L, et al. Related impurities in peptide medicines. J Pharm Biomed Anal. 2014;101:2-30. doi:10.1016/j.jpba.2014.06.012. PMID: 25044089. [narrative review]
- Wang X, Zhang F, Li H, et al. Purity determination of synthetic glucagon using a mass balance approach. Sci Rep. 2020;10(1):4423. doi:10.1038/s41598-020-61109-9. PMID: 32157163. PMCID: PMC7064584. [analytical chemistry study]
- Choules MP, Bisson J, Simmler C, et al. NMR reveals an undeclared constituent in custom synthetic peptides. J Pharm Biomed Anal. 2020;178:112915. doi:10.1016/j.jpba.2019.112915. PMID: 31671336. PMCID: PMC6913887. [analytical case study]
- International Council for Harmonisation (ICH). Q2(R2): Validation of analytical procedures (adopted 1 November 2023). https://database.ich.org/sites/default/files/ICH_Q2%28R2%29_Guideline_2023_1130.pdf. Accessed 28 September 2026. [international guideline]
- Vergote V, Burvenich C, Van de Wiele C, et al. Quality specifications for peptide drugs: a regulatory-pharmaceutical approach. J Pept Sci. 2009;15(11):697-710. doi:10.1002/psc.1167. PMID: 19750489. [narrative review]
- Melanson JE, Thibeault MP, Stocks BB, et al. Purity assignment for peptide certified reference materials by combining qNMR and LC-MS/MS amino acid analysis results: application to angiotensin II. Anal Bioanal Chem. 2018;410(26):6719-6731. doi:10.1007/s00216-018-1272-7. PMID: 30143839. [analytical chemistry study]
Check the lab report
Every published certificate of analysis names its lab, lot and test date. For laboratory research use only.