

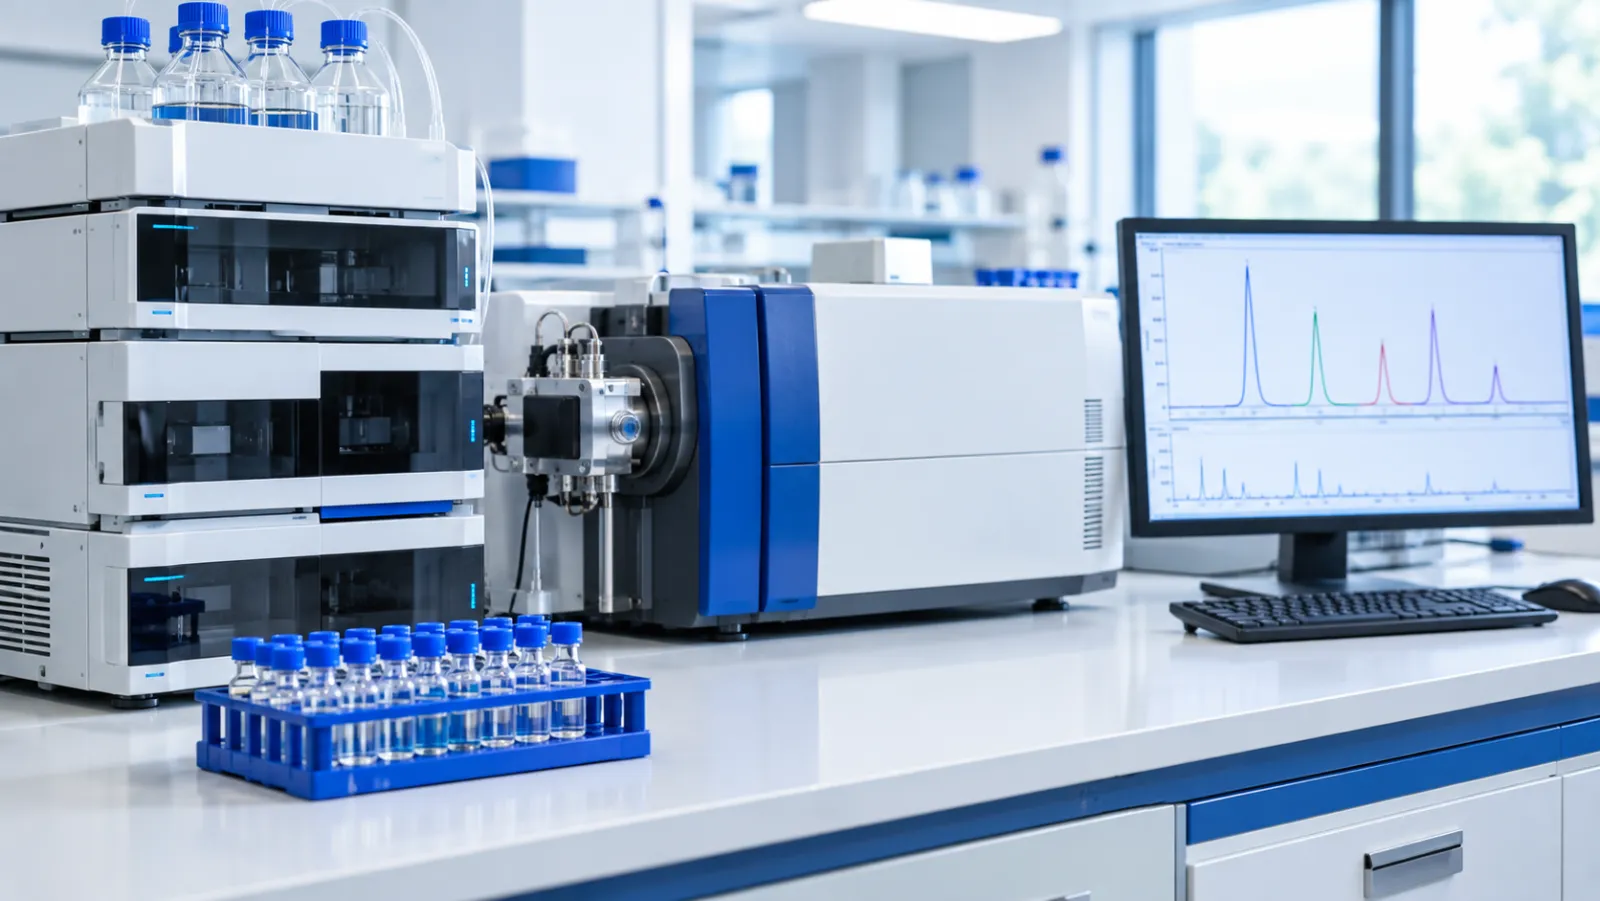
In short: A multi-component peptide blend is tested by separating its peptides, usually by liquid chromatography, confirming each one’s identity by mass spectrometry, and measuring each against its own reference standard. The validation principles are the same as for a single peptide, applied so that every component is shown to be measured without interference from the others.
A certificate of analysis for a single peptide reports one compound; a blend certificate reports several. This article explains how a laboratory tests a blend and what each result on a blend certificate means. For the general layout of a certificate, start with how to read a peptide certificate of analysis. The examples here are the two-component BPC-157 and TB-500 blend and the four-component KLOW peptide blend. No test results are shown or invented; real batch reports are in our COA library.
Why is a peptide blend harder to test than a single peptide?
A blend puts several analytes (the substances being measured) in one sample, so each test has to tell the components apart before it can measure any of them.
With a single peptide, the main question is how much of the sample is the intended peptide and how much is related impurity. D’Hondt et al. (2014) reviewed the impurities typically found in synthetic peptides, including amino acid deletions and insertions, racemisation (altered stereochemistry), oxidised side chains and degradation products 1. In a blend, each component brings its own set of related impurities, so one sample can hold several main peaks and several families of minor peaks.
The components can also be very different molecules. In a KLOW vial they range from the tripeptide KPV at 342.43 g/mol to thymosin beta-4, a 43-residue peptide, at 4963 g/mol 2, alongside GHK-Cu, a tripeptide bound to a copper ion. ICH Q2(R2), the guideline on validating analytical procedures, lists other components likely to be present among the substances that should not affect a result 3; in a blend, that includes every other peptide in the vial.
How are the peptides in a blend separated?
Most laboratories separate blend components by high-performance liquid chromatography (HPLC), in which peptides pass through a packed column and leave it at different times depending on how strongly they interact with the column material.
The usual format is reversed-phase HPLC. The column surface is water-repelling, and a rising proportion of organic solvent washes peptides off roughly in order of increasing hydrophobicity. A published example for one blend component is the method Pawar et al. (2015) validated for KPV: a C18 reversed-phase column with a water and acetonitrile gradient containing 0.1% trifluoroacetic acid 4.
Small, very polar peptides can be poorly retained on reversed-phase columns. Janvier et al. (2017) validated a hydrophilic interaction liquid chromatography (HILIC) method for more polar peptides which, combined with their earlier reversed-phase method, covered a wide spectrum of peptide products 5.
Thymosin beta-4 sits at the other end of the size range. Hannappel (1986) quantified it by reversed-phase HPLC and separated it from closely related beta-thymosins 6. A blend method has to resolve molecules from about 340 to 4960 g/mol in one run, or use more than one separation.
For a blend, the critical point is the separation between neighbouring peaks. ICH Q2(R2) states that for critical separations, specificity can be shown by the resolution of the two components that elute closest to each other. Where one procedure does not discriminate well enough, the guideline recommends combining two or more 3.
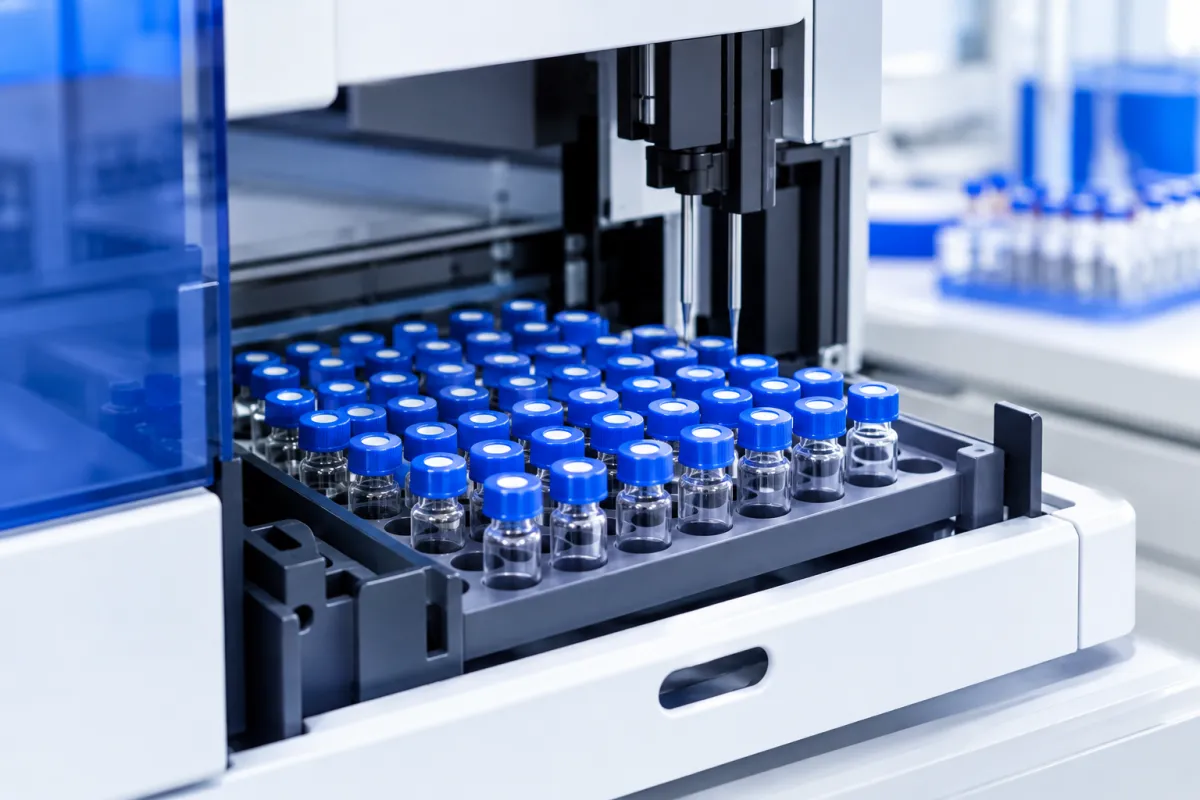 Illustration: an HPLC autosampler, where each sample is drawn for separation.
How is each component’s identity confirmed?
Identity is usually confirmed by mass spectrometry, which measures the mass of the molecules in each separated peak and, in tandem mass spectrometry (MS/MS), the masses of fragments that reflect the amino acid sequence.
The technique is covered in mass spectrometry for peptide identity testing. For blends, it does two jobs.
First, it confirms that each peak is the peptide it is labelled as. Vanhee et al. (2015), at an official medicines control laboratory, described a liquid chromatography tandem mass spectrometry (LC-MS/MS) screening method that selectively detected 25 peptides in a 30-minute run 7. Cox et al. (2017) identified BPC 157, sequence GEPPPGKPADDAGLV, in confiscated vials 8. Krug et al. (2014) reported thymosin β4 among black-market products analysed at the Cologne anti-doping laboratory, where peptides were identified by gel electrophoresis followed by bottom-up nanoLC-MS/MS, in which a protein is digested into smaller peptides that are then identified 9.
Second, it separates molecules that share a trade name. The TB-500 in our BPC-157 and TB-500 blend and in KLOW is full-length thymosin beta-4 acetate, 4963 g/mol, per the supplier’s specification, and the batch certificate records it. The name TB-500 is also used in the market for the 7-residue fragment Ac-LKKTETQ, 889.0 g/mol 2. A mass spectrum tells the two apart at once.
Size also changes how a component appears in the spectrum. Fenn et al. (1989) described electrospray ionisation spectra of large molecules as coherent sequences of multiply charged peaks, each differing by one charge from its neighbours 10. A 43-residue peptide such as thymosin beta-4 is identified from that charge-state series, with its mass calculated from it, while the tripeptides in KLOW appear much lower in the mass range.
How is the amount of each peptide in a blend measured?
Each peptide is quantified against a calibration made from its own reference standard, because different peptides give different detector signals for the same mass.
Most HPLC methods detect peptides by ultraviolet (UV) absorbance near 214 nm, where the peptide bond absorbs. Kuipers and Gruppen (2007) measured molar extinction coefficients (how strongly a substance absorbs light at a given wavelength) at 214 nm. They reported 923 M⁻¹ cm⁻¹ for the peptide bond, a value about 30 times higher for tryptophan, about six times higher for phenylalanine, tyrosine and histidine, and about three times higher for proline within a chain 11. Thymosin beta-4, for example, has one phenylalanine and no tryptophan, tyrosine or histidine among its 43 residues 12, so by these values most of its absorbance at 214 nm comes from peptide bonds. Two peptides present at the same mass can therefore give quite different peak areas, and the area percentages in a blend chromatogram are not a mass ratio.
Published multi-peptide methods handle this by calibrating each analyte. Vanhee et al. (2015) quantified peptides by ultra-high performance liquid chromatography with diode array detection (UHPLC-DAD) and validated the quantification for 10 peptides using a total error approach under ISO 17025 7.
How a measured peptide mass relates to the weight of powder in a vial is covered in net peptide content vs gross weight.
What does purity mean on a blend certificate?
For a blend, purity is most informative when it is reported for each component, alongside that component’s identity and measured amount.
A single-peptide purity figure is usually the main peak’s share of total peak area, as explained in HPLC purity explained. A blend has several main peaks, and one overall figure does not show how impurities are spread among them. A degraded or truncated form of one component could also elute close to another component. Pawar et al. (2015) showed why methods need to be stability-indicating (able to separate the intact peptide from its breakdown products): under acid, alkali and peroxide stress, KPV formed lysine-proline diketopiperazine as its major degradation product, and their method separated the two 4.
GHK-Cu raises a separate question because it is a peptide bound to a metal. Lau and Sarkar (1981) found multiple copper and GHK species in solution between pH 3.5 and 10.6 13. A chromatographic test of the peptide does not by itself report copper content, which is a separate measurement.
How is a test method for a blend validated?
A blend method is validated like any other assay under ICH Q2(R2), with specificity shown for every component in the presence of all the others 3.
ICH Q2(R2) describes showing specificity through absence of interference, through comparison with an orthogonal procedure that ideally uses a different measurement principle, or, in some cases, through the technology itself, such as isotope resolution in mass spectrometry. For assays, it describes spiking samples with impurities and showing that the result is unaffected. It also covers range, accuracy and precision 3. In a blend, each of these applies to each component, so a four-component method is in effect four validated assays sharing one run.
What should a blend certificate of analysis show?
A useful blend certificate lists every component by name and gives each one its own identity result, measured amount and purity, together with the method, laboratory, batch number and test date.
Points to look for on a blend certificate:
- every labelled component listed separately, with the molecule named (for example, full-length thymosin beta-4 rather than the fragment also sold as TB-500)
- an identity result for each component, with the method (such as LC-MS) and the observed mass beside the expected mass
- a measured amount for each component, not only a total for the vial
- purity for each component, with the method and detection wavelength stated
- whole-vial results, where tested, such as water content, counter-ion content (acetate or TFA) and endotoxin, heavy metals and residual solvents; these describe the combined material, not any one component
- the laboratory, report number, batch (lot) number and test date, so the report can be traced
- chromatograms, where supplied, with each main peak labelled
Our published batch reports are in the COA library, and each can be checked on the report verification page.
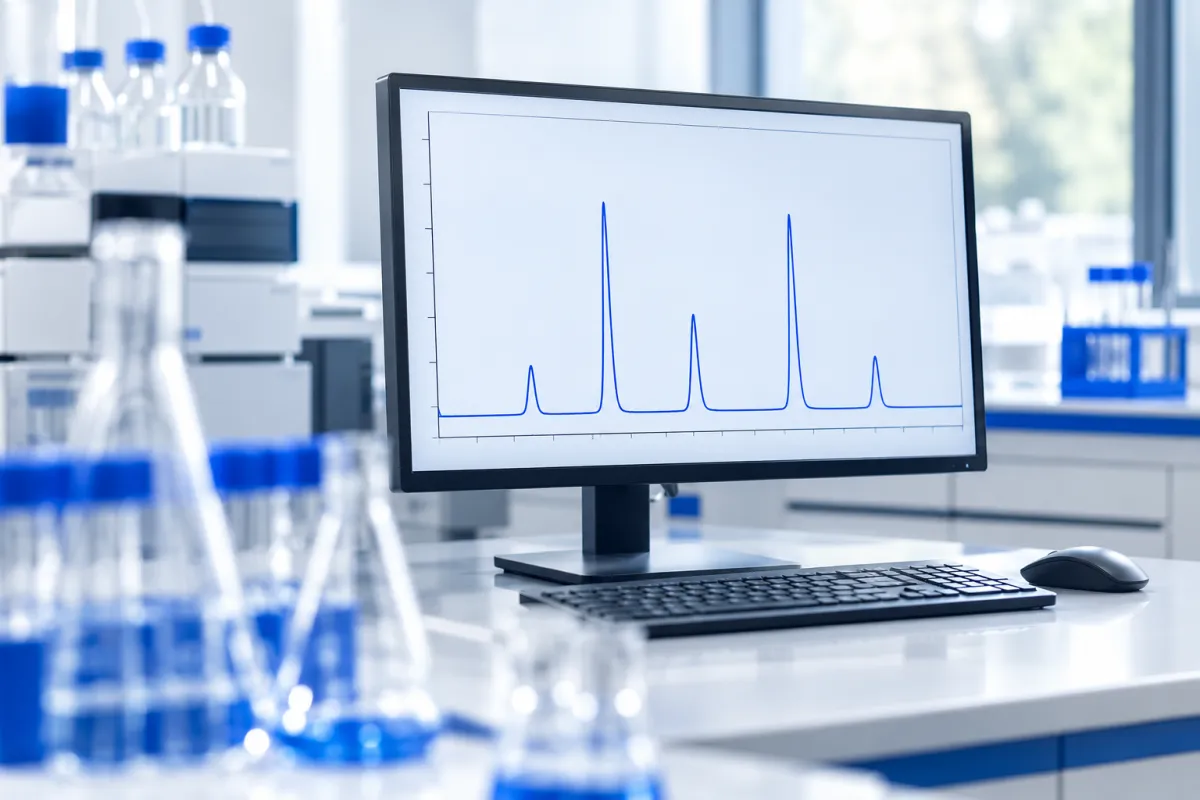 Illustration: separated peaks on a chromatogram, with one main peak for each component of a blend.
Frequently asked questions
Can one HPLC run measure every peptide in a blend?
Often, if the method separates every component and is validated for each. ICH Q2(R2) recommends combining two or more procedures when one does not discriminate well enough 3. Janvier et al. (2017) validated a HILIC method for polar peptides that, combined with a reversed-phase method, covered a wide spectrum of peptide products 5. Small, polar peptides are a common reason for a second separation.
Why do HPLC peak areas in a blend not match the labelled ratio?
Peptides absorb UV light to different degrees. Kuipers and Gruppen (2007) reported that at 214 nm tryptophan absorbs about 30 times more than a peptide bond, and phenylalanine, tyrosine and histidine about six times more 11. Two peptides present at equal mass can therefore give unequal peak areas. Measured amounts come from calibrating each peptide against its own reference standard, not from area percentages.
How does mass spectrometry tell full-length thymosin beta-4 from the TB-500 fragment?
By mass. Full-length thymosin beta-4 is 4963 g/mol and the 7-residue fragment Ac-LKKTETQ, also sold as TB-500, is 889.0 g/mol 2; Esposito et al. (2012) identified the fragment in a TB-500 formulation 14. The TB-500 in our two blends is full-length thymosin beta-4 acetate, per the supplier’s specification, and the batch certificate records it. TB-500 vs thymosin beta-4 explains the naming.
What should a blend certificate list for each component?
Each component’s name, the identity method and result, the measured amount and the purity, plus the laboratory, batch number and test date. Whole-vial results such as endotoxin and water content describe the combined material. How to read a peptide COA explains each section of a certificate, and our COA library holds real batch reports that can be checked on the verification page.
Is GHK-Cu in a blend characterised differently from the other peptides?
Yes, in one respect: GHK-Cu is a copper complex, so the peptide and the copper are separate questions. Lau and Sarkar (1981) characterised several copper and GHK species across a range of pH values using titration and visible-absorption spectrophotometry 13. Chromatography and mass spectrometry address the peptide, and copper content is a separate measurement. The KLOW peptide blend article describes where GHK-Cu comes from.
References
- D’Hondt M, Bracke N, Taevernier L, et al. Related impurities in peptide medicines. J Pharm Biomed Anal. 2014;101:2-30. doi:10.1016/j.jpba.2014.06.012. PMID: 25044089. [narrative review]
- PubChem, National Center for Biotechnology Information. Compound summaries for BPC-157 (CID 9941957), prezatide copper, GHK-Cu (CID 71587328), thymosin beta-4, timbetasin (CID 16132341), TB-500 fragment Ac-LKKTETQ (CID 62707662), Lys-Pro-Val, KPV (CID 125672). Accessed 28 September 2026. [chemical database]
- European Medicines Agency. ICH Q2(R2) Guideline on validation of analytical procedures, Step 5 (EMA/CHMP/ICH/82072/2006). https://www.ema.europa.eu/en/ich-q2r2-validation-analytical-procedures-scientific-guideline. Accessed 28 September 2026. [regulatory guideline]
- Pawar KR, Mulabagal V, Smith F, et al. Stability-indicating HPLC assay for lysine-proline-valine (KPV) in aqueous solutions and skin homogenates. Biomed Chromatogr. 2015;29(5):716-721. doi:10.1002/bmc.3347. PMID: 25298219. [analytical method validation study]
- Janvier S, De Sutter E, Wynendaele E, et al. Analysis of illegal peptide drugs via HILIC-DAD-MS. Talanta. 2017;174:562-571. doi:10.1016/j.talanta.2017.06.034. PMID: 28738623. [analytical method validation study]
- Hannappel E. One-step procedure for the determination of thymosin beta 4 in small tissue samples and its separation from other thymosin beta 4-like peptides by high-pressure liquid chromatography. Anal Biochem. 1986;156(2):390-396. doi:10.1016/0003-2697(86)90270-8. PMID: 3766940. [analytical method study]
- Vanhee C, Janvier S, Desmedt B, et al. Analysis of illegal peptide biopharmaceuticals frequently encountered by controlling agencies. Talanta. 2015;142:1-10. doi:10.1016/j.talanta.2015.04.022. PMID: 26003685. [analytical method validation study]
- Cox HD, Miller GD, Eichner D. Detection and in vitro metabolism of the confiscated peptides BPC 157 and MGF R23H. Drug Test Anal. 2017;9(10):1490-1498. doi:10.1002/dta.2152. PMID: 28035768. [analytical method validation study]
- Krug O, Thomas A, Walpurgis K, et al. Identification of black market products and potential doping agents in Germany 2010-2013. Eur J Clin Pharmacol. 2014;70(11):1303-1311. doi:10.1007/s00228-014-1743-5. PMID: 25168622. [analytical study of confiscated products]
- Fenn JB, Mann M, Meng CK, et al. Electrospray ionization for mass spectrometry of large biomolecules. Science. 1989;246(4926):64-71. doi:10.1126/science.2675315. PMID: 2675315. [methods review]
- Kuipers BJ, Gruppen H. Prediction of molar extinction coefficients of proteins and peptides using UV absorption of the constituent amino acids at 214 nm to enable quantitative reverse phase high-performance liquid chromatography-mass spectrometry analysis. J Agric Food Chem. 2007;55(14):5445-5451. doi:10.1021/jf070337l. PMID: 17539659. [analytical chemistry study]
- UniProt Consortium. UniProtKB entries P62328, thymosin beta-4, human and P01189, pro-opiomelanocortin, human. Accessed 28 September 2026. [protein database]
- Lau SJ, Sarkar B. The interaction of copper(II) and glycyl-L-histidyl-L-lysine, a growth-modulating tripeptide from plasma. Biochem J. 1981;199(3):649-656. doi:10.1042/bj1990649. PMID: 7340824. PMCID: PMC1163421. [solution chemistry study]
- Esposito S, Esposito S, Deventer K, et al. Synthesis and characterization of the N-terminal acetylated 17-23 fragment of thymosin beta 4 identified in TB-500, a product suspected to possess doping potential. Drug Test Anal. 2012;4(9):733-738. doi:10.1002/dta.1402. PMID: 22962027. [analytical chemistry study]
Check the lab report
Every published certificate of analysis names its lab, lot and test date. For laboratory research use only.